How to Read Crypto Charts and Predict Market Moves
- Understanding the basics of crypto charts
- Analyzing different types of crypto charts
- Identifying key patterns in crypto charts
- Utilizing technical indicators for market predictions
- Implementing chart analysis in your trading strategy
- Common mistakes to avoid when reading crypto charts
Understanding the basics of crypto charts
Cryptocurrency charts are essential tools for traders and investors to analyze market trends and make informed decisions. Understanding the basics of crypto charts is crucial for predicting market moves accurately. There are several key elements to consider when reading these charts.
- Candlestick Patterns: Candlestick patterns are visual representations of price movements over a specific period. They provide valuable information about market sentiment and potential price reversals.
- Support and Resistance Levels: Support levels indicate the price level at which a cryptocurrency tends to stop falling and bounce back, while resistance levels show where it tends to stop rising and pull back.
- Volume: Volume reflects the number of trades executed during a specific period. High volume often indicates strong market interest and can confirm the validity of a price trend.
- Trendlines: Trendlines are used to identify the direction of a price trend. They can help traders determine potential entry and exit points based on the market’s momentum.
By analyzing these elements in combination, traders can gain valuable insights into market dynamics and make more informed decisions. It is essential to remember that crypto markets can be highly volatile, so it is crucial to use technical analysis tools in conjunction with other forms of analysis to make well-rounded predictions.
Analyzing different types of crypto charts
Cryptocurrency charts come in various types, each providing different insights into market trends and price movements. By analyzing these different types of charts, investors can gain a better understanding of the market and make more informed decisions.
One common type of crypto chart is the line chart, which shows the price of a cryptocurrency over a specific period. This chart is useful for identifying trends and patterns in the market. Another type of chart is the candlestick chart, which provides more detailed information about price movements, including opening and closing prices, as well as highs and lows.
Additionally, there are bar charts, which display price movements in a more compact format, making it easier to compare different time periods. These charts can help investors identify key support and resistance levels, which are important for making trading decisions.
Overall, analyzing different types of crypto charts is essential for predicting market moves and staying ahead of the curve. By understanding the information presented in these charts, investors can make more informed decisions and increase their chances of success in the volatile cryptocurrency market.
Identifying key patterns in crypto charts
When it comes to reading crypto charts and predicting market moves, identifying key patterns is crucial. By analyzing historical price data, traders can uncover trends that may indicate future price movements. Some common patterns to look out for include:
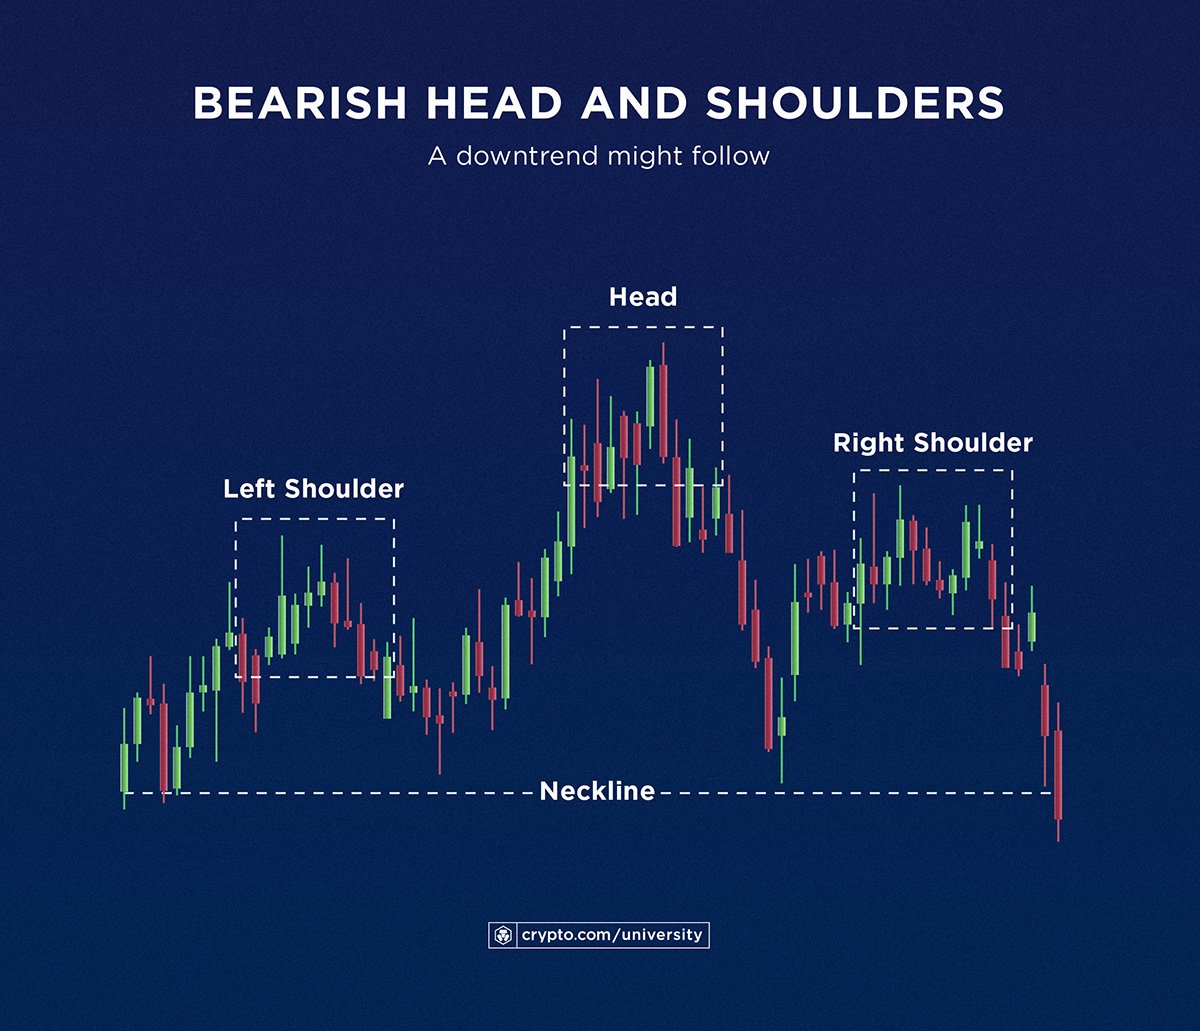
- Head and Shoulders: This pattern typically signals a reversal in the market trend. It consists of three peaks, with the middle peak (the head) being higher than the other two (the shoulders).
- Double Top/Bottom: This pattern occurs when the price reaches a high/low point twice before reversing. It can indicate a potential trend reversal.
- Ascending/Descending Triangle: These patterns form when the price consolidates between two trendlines. An ascending triangle suggests a bullish breakout, while a descending triangle indicates a bearish breakout.
By recognizing these key patterns in crypto charts, traders can make more informed decisions about when to buy or sell. It’s important to remember that no pattern is foolproof, and market conditions can change rapidly. However, having a solid understanding of these patterns can help traders navigate the volatile crypto market more effectively.
Utilizing technical indicators for market predictions
When it comes to predicting market moves in the world of cryptocurrency, utilizing technical indicators can be a valuable tool. These indicators are mathematical calculations based on historical price, volume, or open interest data. By analyzing these indicators, traders can gain insights into potential market trends and make more informed decisions.
Some of the most commonly used technical indicators in crypto trading include moving averages, relative strength index (RSI), and Bollinger Bands. Moving averages help smooth out price data to identify trends, while RSI measures the speed and change of price movements. Bollinger Bands, on the other hand, help traders identify overbought or oversold conditions in the market.
By combining these technical indicators with other forms of analysis, such as fundamental analysis or market sentiment, traders can develop a more comprehensive understanding of the market and make more accurate predictions. It’s important to remember that no indicator is foolproof, and it’s always essential to use multiple indicators to confirm a potential market move.
Implementing chart analysis in your trading strategy
Implementing chart analysis in your trading strategy is crucial for making informed decisions in the cryptocurrency market. By analyzing historical price data and identifying patterns, you can gain valuable insights into potential market moves.
One way to incorporate chart analysis into your trading strategy is by using technical indicators such as moving averages, RSI, and MACD. These indicators can help you identify trends, momentum, and potential reversal points in the market.
Another important aspect of chart analysis is understanding support and resistance levels. These levels represent areas where the price of a cryptocurrency is likely to encounter barriers. By identifying these levels, you can make more accurate predictions about future price movements.
It’s also essential to pay attention to chart patterns such as triangles, head and shoulders, and double tops/bottoms. These patterns can provide valuable information about potential trend reversals or continuations.
Overall, incorporating chart analysis into your trading strategy can help you make more informed decisions and improve your overall profitability in the cryptocurrency market. By understanding technical indicators, support and resistance levels, and chart patterns, you can better predict market moves and increase your chances of success.
Common mistakes to avoid when reading crypto charts
When reading crypto charts, there are several common mistakes that traders should avoid to make accurate predictions about market moves. These mistakes can lead to misinterpretations and poor decision-making, ultimately resulting in financial losses. It is essential to be aware of these pitfalls and take steps to prevent them.
- Overtrading: One of the most common mistakes traders make is overtrading based on short-term fluctuations in the market. It is crucial to focus on long-term trends and not get caught up in the noise of daily price movements.
- Ignoring fundamental analysis: Some traders rely solely on technical analysis when reading crypto charts and overlook the importance of fundamental analysis. Understanding the underlying factors driving the market can provide valuable insights into future price movements.
- Confirmation bias: Traders often fall victim to confirmation bias, where they only seek out information that supports their existing beliefs about the market. It is essential to remain open-minded and consider all possible outcomes when analyzing crypto charts.
- Not using stop-loss orders: Failing to set stop-loss orders can expose traders to significant risks in volatile crypto markets. Setting stop-loss orders can help limit losses and protect capital in case of unexpected price movements.
- Overlooking market sentiment: Ignoring market sentiment can lead to missed opportunities or poor decision-making. It is crucial to consider the overall sentiment of the market and how it may impact price movements when reading crypto charts.
By avoiding these common mistakes when reading crypto charts, traders can improve their ability to predict market moves accurately and make informed trading decisions. It is essential to approach chart analysis with a critical mindset and consider all relevant factors to achieve success in the crypto market.